黄杰, 2013-04-13
root[a]linuxsand.info
最近在做毕业设计,需要处理数据,使用 Python 很大程度上减少了工作量。
本文较长,目录在此:
样例文件 test1.txt
1 2 3
1 2 3
1 2 3
1 2 3
1 2 3
要求操作第二列数字:算出总和,可以用如下 python 代码:
sum = 0

for line in open('test1.txt'):
    second = line.split()[1]
    sum = sum + int(second)

print 'Sum of 2nd column:', sum
程序输出为:
>>> Sum of 2nd column: 10
看吧,真正用来干活的代码只不过 4 行。
下面贴上我处理数据用的 python 代码(process.py),简单进行了注释。
如果对代码没兴趣,只关心如何方便地分割文本列:我写了一个网站,可以「按列分割文本」 http://columner.linuxsand.info/。Origin 可以导入并识别多列文本,大概是「file - import - single ascii」。
目录结构:
C:\Users\Administrator\Desktop\data\
    |- process.py # 整理数据的脚本
    |- 1h350-1.txt # 下面的都是数据文本
    |- 1h8650-1.TXT
    |- 2h350-1.TXT
    |- 2h8650-1.TXT
    |- 3h350-1.TXT
    |- 3h8650-1.TXT
process.py 的内容:
# coding: utf-8
import os

# 2 个常量,截面积(jiemianji)和标距(biaoju)
jiemianji = 3.000 # (mm), 1 MPa = 1 N/mm^2
biaoju = 18 # (mm), %

# 自定义函数,用来分割文本列
def get_and_evaluate_2_columns_from_txt(txt):
    # 定义一个列表用来存放结果
    c = []
    for line in open(txt):
        # 排除空行、含中文的行,具体不解释
        if (not line.isspace()) and ord(line.decode('gbk')[0]) < 255:
            try:
                # 分割行,取第二项
                # 用 float 函数转换成浮点数
                # 于是得到每一行负荷(fuhe)的数值
                fuhe = float(line.split()[1])
                # 位移(weiyi)同理
                weiyi = float(line.split()[3])

                # yl:应力
                # yb:应变
                yl = str(fuhe / jiemianji)
                yb = str(weiyi / biaoju)
                # 最后把结果追加到列表里
                c.append((yl, yb))
            except IndexError:
                pass
    return c

# 切换到工作目录,我们的待处理文件在这个目录(文件夹)下
os.chdir('C:\Users\Administrator\Desktop\data')

# 下面正式开始干活
# os.listdir 这个函数的功能是列出目录下的所有文件
for f in os.listdir('.'):
    if f.lower().endswith('.txt') and \
       f.startswith(('1', '2', '3')):
        # 调用上面定义的函数,把结果赋值给 foo 这个变量
        # foo = [(应力数据1, 应变数据1)
        #        (应力数据2, 应变数据2),
        #          ......
        #       ]
        foo = get_and_evaluate_2_columns_from_txt(f)
        # 定义 2 个列表,存放结果
        yl = []
        yb = []
        for a, b in foo:
            yl.append(a)
            yb.append(b)
        # 把结果写入文件
        with open('yl'+f, 'w') as yl_:
            yl_.write('\n'.join(yl))
        with open('yb'+f, 'w') as yb_:
            yb_.write('\n'.join(yb))
        print f, 'is processed.'
运行后,当前目录出现了新的文件,这些都是提取出来的数据文件:
yb1h350-1.txt
yb1h8650-1.TXT
yb2h350-1.TXT
yb2h8650-1.TXT
yb3h350-1.TXT
yb3h8650-1.TXT
yl1h350-1.txt
yl1h8650-1.TXT
yl2h350-1.TXT
yl2h8650-1.TXT
yl3h350-1.TXT
yl3h8650-1.TXT
之后我们可以将这些数据贴到对应的数据分析软件里,做进一步处理。
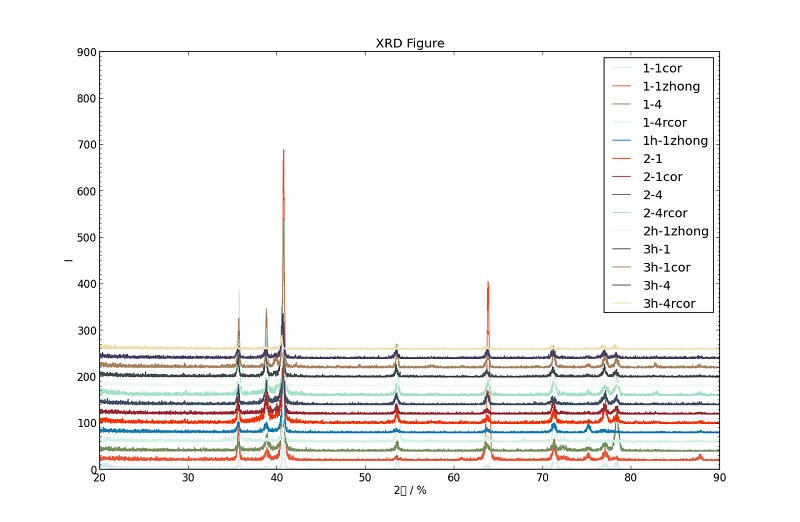
只是处理成中间结果,还不够好。借助 Python 科学计算库,我们可以直接生成图表(下图),这是 X 射线衍射实验。

在 ./xrd 目录下有 14 个零散数据文本:
./xrd
    |- 1-1cor.TXT
    |- 1-1zhong.TXT
    |- 1-4.TXT
    |- 1-4rcor.TXT
    |- 1h-1zhong.TXT
    |- 2-1.TXT
    |- 2-1cor.TXT
    |- 2-4.TXT
    |- 2-4rcor.TXT
    |- 2h-1zhong.TXT
    |- 3h-1.TXT
    |- 3h-1cor.TXT
    |- 3h-4.TXT
    |- 3h-4rcor.TXT
我花了一点时间写了一个 python 脚本(xrd.py),借助 NumPy(用来承载实验数据)和 matplotlib(画图)这 2 个库达到了目的。xrd.py 的内容如下,我做些注释。
# coding: utf-8
import numpy as np
import matplotlib.pyplot as plt
from matplotlib.ticker import MultipleLocator
import os

# 我准备了多种不同图线的颜色
colors = open('color.txt').readlines()

# 建立一个 Figure 对象
fig = plt.figure(1, figsize=(8, 4))

# 画图的函数
# 注意:我从处理另一个实验数据的脚本中拷贝了部分代码,所以变量名有些奇怪
def draw(yb, yl, name, color):
    x = np.array(yb)
    y = np.array(yl)
    plt.figure(1)
    plt.plot(x, y, label=name, color=color, lw=1)

# 定义一个分割文本列的函数
# 这 step 变量有的作用:增加纵坐标的值,便于区分图线
def split(txt, step=0):
    a = []
    b = []
    for i, line in enumerate(open(txt), start=1):
        if i >= 18:
            x, y = map(float, line.split())
            y += step
            a.append(x)
            b.append(y)
    return a, b

# 切换到工作目录,开始干活,不展开解释了
os.chdir('./xrd')
# count 的值传给 draw 函数中的 step 变量,
# 达到「增加纵坐标的值,便于区分图线」的目的
count = 0
for i, color in zip(os.listdir('.'), colors):
    x, y = split(i, step=count)
    name = os.path.splitext(i)[0]
    draw(x, y, name, color)
    count += 20

# 设置图像的参数
# 横坐标文本
plt.xlabel(u'2θ / %')
# 纵坐标文本
plt.ylabel('I')
# 图像名字
plt.title('XRD Figure')
# 设置纵坐标最小刻度
plt.gca().yaxis.set_minor_locator(MultipleLocator(10))
# 纵坐标最大值
plt.ylim(ymax=900)
plt.legend()
# 显示图像
plt.show()
# 还可以导出图像
# plt.savefig('../xrd.png')
附上一节(即「较复杂的实例」)生成的图线。

这里隐藏了 2 个问题。一个是如何学习 Python,另一个则是如何使用它丰富的科学计算库。
一、安装 Python(Windows)
如果一开始就奔着科学计算而去,下面介绍的 Python(x,y) 软件包已经包含 Python,请略过这里。
二、我推荐的 Python 教程(书籍)
三、学习科学计算库的使用
何不从现在开始?